
Analytics
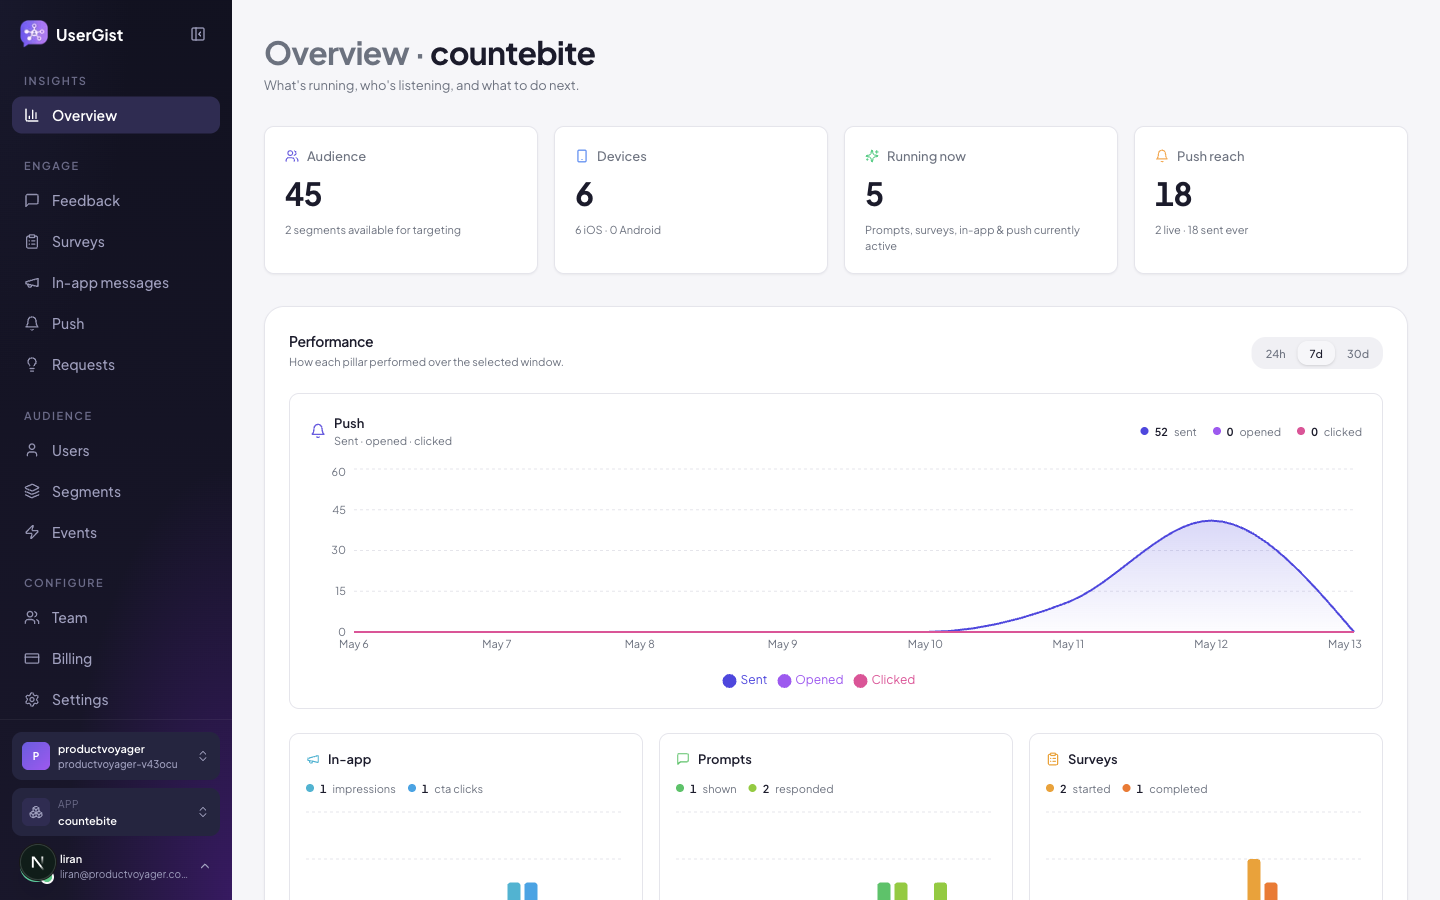
Every feature has its own analytics page. They share a layout, a time-range picker, and an export. This page tells you what's tracked everywhere, how it's computed, and how to read it.
Time range
Every analytics view supports:
- 24 hours — bucketed hourly.
- 7 days — bucketed daily.
- 30 days — bucketed daily.
For longer windows, export the raw responses via the API.
Per-feature views
Feedback prompts
- Impressions, responses, response rate.
- Score distribution (NPS / CSAT histogram).
- Raw responses with user, score, comment.
Surveys
- Impressions, starts, completions.
- Per-question drop-off (where do people abandon?).
- Time-to-complete distribution.
- Per-question distribution + raw export.
In-app messages
- Impressions, clicks, dismisses.
- CTR per CTA.
- Daily time series.
Push
- Sends → delivered → displayed → opened → clicked funnel.
- Per-platform breakdown (APNs vs FCM).
- Bounce reasons.
Feature requests
- Top voted requests (week / month / all time).
- New requests per day.
- Status distribution (under_review → planned → … → shipped).
Events
- Top events (by count) in the chosen window.
- Per-event time series.
How it's computed
Storage is ClickHouse. Buckets are pre-aggregated by:
- Hour for the 24h window.
- Day for 7d / 30d.
This means the dashboard reads pre-rolled buckets, not raw rows — fast even on hundreds of millions of events.
For ad-hoc analysis, hit:
GET /v1/apps/:appId/analytics/overview?range=30d
Authorization: Bearer <workos_access_token>
range accepts 24h, 7d, or 30d. The response includes a complete bucket
axis and totals for push, in-app messages, prompts, and surveys.
Exports
Each per-feature page has an Export button (CSV or JSON, scoped to the current time range). For programmatic access, see API → Surveys and friends.
Overview
The app overview page (the dashboard root) shows:
- KPI tiles — active users, events, responses, deliveries — for the chosen window.
- Activity feed — the last N events / responses across all channels.
- Running campaigns — what's live, with a one-glance health pill.
What's next
- Features → Events
- API → Ingest
- Admin → Billing — usage metering